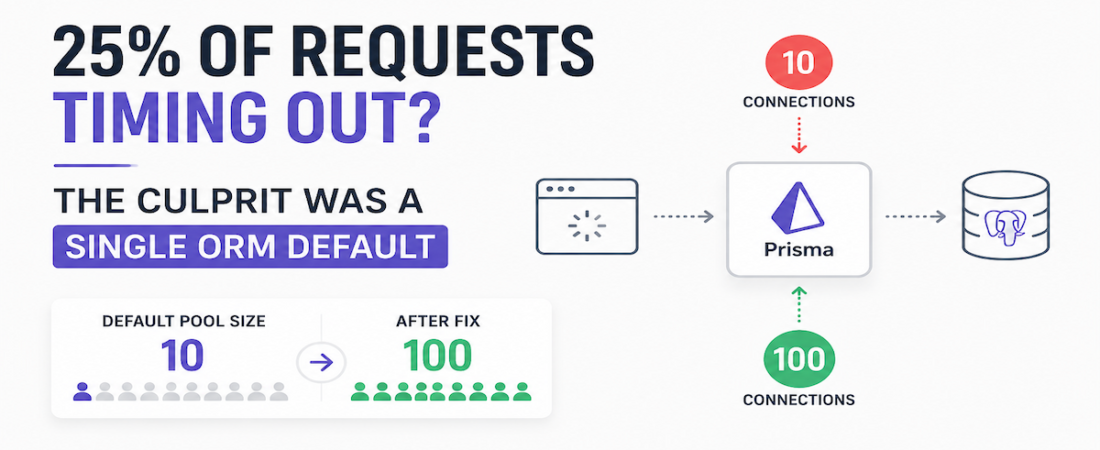
We had a real-time game backend with 2 auth services and 15 game services, all connected to a shared hosted PostgreSQL instance, with all database queries handled through Prisma. On a routine load test simulating 10,000 concurrent users, we noticed that over 25% of requests were timing out—not failing, not throwing errors, just silently dying on the client side.
The backend logs looked completely normal. All queries were executing. The server was not crashing. The database was not reporting any errors. To every monitoring tool we had, everything was fine. But users were timing out.
The culprit turned out to be a single ORM default we had never thought to question.
Table of Contents
The System Setup
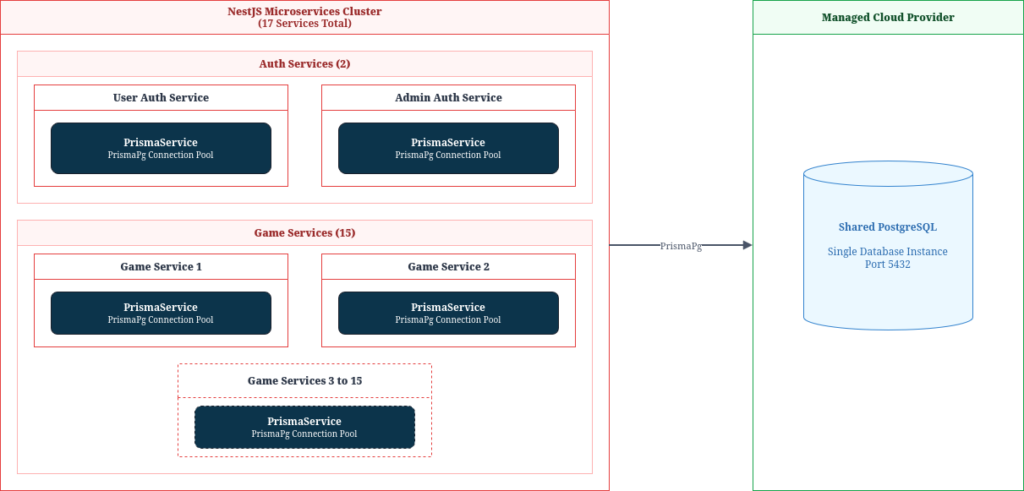
Before diving into the problem, here is what the system looked like:
- 17 NestJS microservices in total: 2 auth services (one for users, one for admins) and 15 game services
- All services connected to a single shared PostgreSQL instance hosted on a managed cloud provider
- All database access was abstracted through Prisma ORM using the Prisma PostgreSQL adapter (PrismaPg)
- Each service instantiated its own PrismaService, which internally managed a PG connection pool
The system was designed to handle spikes of thousands of concurrent players, with game sessions, moves, and state updates all hitting the database in real time. Connection management was never explicitly configured—we relied on Prisma’s defaults and moved on.
The Symptom
During a load test with 10,000 simulated concurrent users, we started seeing a pattern:
- The frontend was reporting over 25% of requests as timed out
- The frontend HTTP timeout was set to 30 seconds
- Backend logs showed all queries were being accepted and executed—just with large turnaround times
- Database CPU and memory were well within normal ranges
- No errors, no crashes, no stack traces anywhere
This is the most dangerous class of bug—silent degradation. The system appeared healthy to every metric we had. But from the user’s perspective, their actions were disappearing into a void.
Worse, this had a direct business consequence: users whose requests timed out would assume their action had not gone through and retry it. In a game involving in-app purchases and charge deductions, duplicate retries meant potential double charges. This was not just a performance issue—it was a correctness and trust issue.
The Root Cause
After ruling out network issues, server CPU, and database health, we traced the problem to Prisma’s connection pool configuration.
Our PrismaService constructor looked like this:
constructor(resolvedHost?: string) {
    const dbUrl = new URL(config.database.url);
    const host = resolvedHost ?? dbUrl.hostname;
    const pool = new Pool({
        host,
        port: Number(dbUrl.port) || 5432,
        database: decodeURIComponent(dbUrl.pathname.slice(1)),
        user: decodeURIComponent(dbUrl.username),
        password: decodeURIComponent(dbUrl.password),
        // max: not set — defaults to 10
        ssl: { rejectUnauthorized: false, servername: dbUrl.hostname },
    });
    const adapter = new PrismaPg(pool);
    super({ adapter });
}The PG library (which PrismaPg uses under the hood) defaults to a max of 10 connections when not explicitly set. This means each service instance could only hold 10 simultaneous database connections open at any time.
Here is what happens under load:
- 10,000 concurrent requests arrive across the services
- Each service can only process 10 database queries at a time
- The remaining requests queue up, waiting for a free connection
- Requests are processed in batches of 10, sequentially
- 1,000 requests ÷ 10 connections = 100 sequential rounds per service
- If each query takes ~300 ms, later batches wait 30+ seconds before even starting
- The frontend timeout fires at exactly 30 seconds—killing those requests before they are ever served
The backend was not broken. It was processing everything correctly—just too slowly for the frontend to wait. The 30-second timeout was exposing what was effectively a queue starvation problem caused by an artificially small connection pool.
The Fix
The fix was straightforward: increase the connection pool size. We updated the PrismaService constructor to explicitly set max:
const pool = new Pool({
    host,
    port: Number(dbUrl.port) || 5432,
    database: decodeURIComponent(dbUrl.pathname.slice(1)),
    user: decodeURIComponent(dbUrl.username),
    password: decodeURIComponent(dbUrl.password),
    max: config.database.poolMax,              // explicitly configured
    connectionTimeoutMillis: config.database.poolTimeoutMs,
    ssl: { rejectUnauthorized: false, servername: dbUrl.hostname },
});We set poolMax to 100. The timeout rate dropped dramatically on the next load test.
Why 100 specifically?
Our DevOps engineer had set up PgBouncer in front of the PostgreSQL instance. PgBouncer is a connection pooler that sits between your application services and Postgres—your services connect to PgBouncer, which maintains a smaller pool of actual Postgres connections and multiplexes requests onto them:
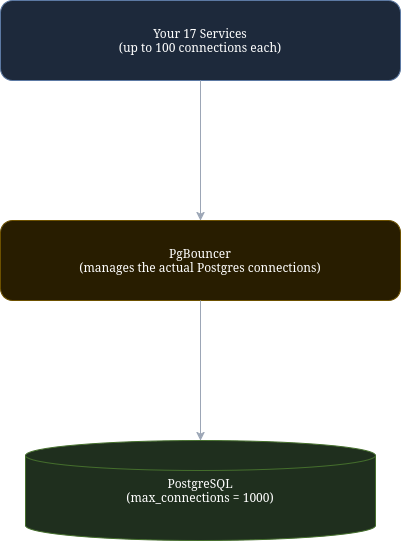
PgBouncer allowed our total effective connection limit to be 1,000. With 17 services each allowed up to 100 connections, the math worked out safely: even if all services maxed out simultaneously, we would not exceed what Postgres could handle.
Without PgBouncer, setting every service to 100 connections would likely exhaust PostgreSQL’s raw max_connections limit (usually 100 for hosted instances), causing a different category of failure.
How to Calculate the Right Pool Size
If you do not have PgBouncer, you need to calculate pool size carefully. A general formula:
pool_size = (max_connections - reserved_connections) / number_of_service_instancesFor example: if PostgreSQL allows 200 connections, you reserve 10 for admin tasks and migrations, and you have 3 service instances:
(200 - 10) / 3 = ~63 connections per instanceTo check your PostgreSQL max_connections, query the database directly:
SHOW max_connections;If you do have PgBouncer (which you should seriously consider for any production system with multiple services), the calculation becomes:
pool_size = pgbouncer_max_connections / number_of_service_instancesEither way, the key principle is the same: your ORM’s connection pool does not exist in isolation. It needs to be sized in relation to your database’s actual capacity and the number of competing service instances.
Key Takeaways
- Prisma (via pg) defaults to a connection pool of 10. This is fine for development. It is almost never fine for production under real load.
- Silent timeouts under load are almost always a resource exhaustion problem. When your backend looks healthy but the frontend is dying, check your connection pool before anything else.
- Pool size has an upper bound. Setting it arbitrarily high without accounting for PostgreSQL’s max_connections will trade one problem for another. Always calculate relative to your infrastructure.
- PgBouncer is worth setting up. It decouples your application-side pool sizes from PostgreSQL’s hard limits and gives you significantly more headroom.
The fix was one config value. Finding it took two days of load testing and log analysis. Know your ORM’s connection defaults before your users find them for you—because in a high-concurrency system, the defaults are almost never production-ready.